

Launched in 2013 named paloaltodelivery.com, Doordash is a food delivery application. In its initial days, the entire work from taking orders to delivering the order was taken care of by its four founding members. This practice created a culture in the company and till now, all four members spend at least one day a month delivering food to their customers.
In the first year of service, Doordash integrated with 70 new restaurants in the bay and grew at a rate of 20% weekly. Other than that, it raised $2.4 million in funding led by Khosla Ventures and Charles River Ventures.
Now you may be thinking “How many drivers does Doordash have” to generate 20% growth? Let’s dive in and have a look at this and some more amazing Doordash statistics for 2023:
- Key Doordash Statistics 2023
- Doordash User Statistics 2023
- Doordash Revenue Statistics 2023
- Doordash Market Share
- Doordash Driver Stats
- Doordash Users Demographics
- Doordash Reviews
- Doordash Competitors
Key Doordash Statistics 2026
- In 2022, Doordash annual revenue increased to $6.58 billion, a 34.8% increase from $4.88 billion in 2021.
- Doordash users count at 32 million as of 2022.
- Doordash subscribers increased to 15 million in 2022.
- Doordash drivers‘ count was over 2,000,000 in 2021.
- Doordash reported a loss of $1.36 billion in 2022.
- Doordash net worth is $23.99 billion as of May 1, 2023.
- Doordash total orders were 36 million as of Q2 2022.
Doordash User Statistics 2026
- Doordash total orders are 36 million as of Q2 2022.
- Doordash users numbered 32 million users in 2022 and the majority of them were from the US.
- Doordash has more than 390,000 grocery markets and partnered restaurants on its platform.
- Doordash is available in over 4000 cities in North America.
- From 2018 to 2021, Doordash saw 21 million new users.
Source: Business of Apps, Backlinko
Doordash Annual Users
Doordash users count at 32 million as of 2022. It added seven million users to its tally last year.

Doordash Users 2018-2022
| Year | Users (mm) |
| 2018 | 4 |
| 2019 | 10 |
| 2020 | 20 |
| 2021 | 25 |
| 2022 | 32 |
Source: Business of Apps
Doordash Subscribers
Doordash active subscribers that have its subscription plan named Doorpass are 15 million.
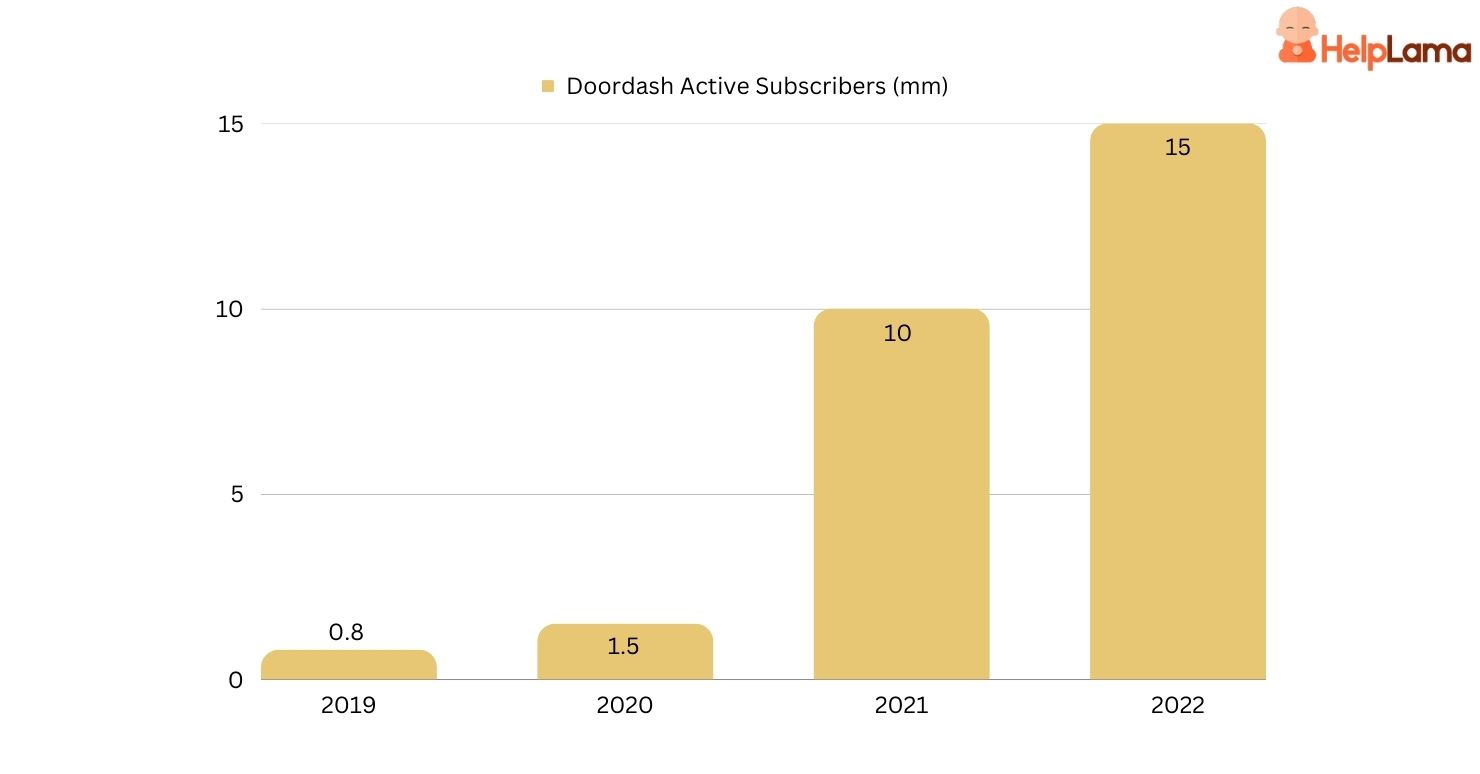
Doordash subscribers 2019-2022
| Year | Subscribers(mm) |
| 2019 | 0.8 |
| 2020 | 1.5 |
| 2021 | 10 |
| 2022 | 15 |
Source: Business of Apps
Doordash App Downloads 2023
There were 3 million Doordash App downloads in April 2023.

Doordash Revenue Statistics 2022
Doordash Quarterly Revenue
Doordash quarterly revenue was 1818 million for Q4 2022.
Doordash quarterly revenue Q1 2020 – Q4 2022
| Years | Revenue ($mm) |
| 2020Q1 | 362 |
| 2020Q2 | 675 |
| 2020Q3 | 897 |
| 2020Q4 | 970 |
| 2021Q1 | 1077 |
| 2021Q2 | 1236 |
| 2021Q3 | 1275 |
| 2021Q4 | 1300 |
| 2022Q1 | 1456 |
| 2022Q2 | 1608 |
| 2022Q3 | 1701 |
| 2022Q4 | 1818 |

Source: Company Data
Doordash Annual Revenue
In the financial year 2022, Doordash annual revenue increased to $6.58 billion, a 34.8% increase from $4.88 billion in 2021.

Doordash Annual Revenue 2017-2022
| Year | Annual Revenue($bn) |
| 2017 | 0.11 |
| 2018 | 0.55 |
| 2019 | 0.85 |
| 2020 | 2.88 |
| 2021 | 4.88 |
| 2022 | 6.58 |
Source: Company Data
Doordash Profit/Loss
Doordash reported a loss of $1.36 billion in 2022.

Doordash loss 2018-2022
| Year | Loss ($mm) |
| 2018 | -204 |
| 2019 | -667 |
| 2020 | -461 |
| 2021 | -468 |
| 2022 | -1368 |
Source: Company Data
Doordash Marketplace Gross Order Value
The total value of completed orders by Doordash is $13.08 billion(2022 Q2)
| Year | Market GOV($bn) |
| 2018 | 2.81 |
| 2019 | 8.04 |
| 2020 | 24.66 |
| 2021Q1 | 9.9 |
| 2021Q2 | 10.45 |
| 2021Q3 | 10.41 |
| 2021Q4 | 11.15 |
| 2022Q1 | 12.35 |
| 2022Q2 | 13.08 |

Source: Backlinko, Company Data
Doordash Operating Expenses
- In the first quarter of 2021, Doordash expenses reached $584 million.
- Sales and marketing expenses of Doordash as of 2022 Q2 are $835 million.
| Year | Sales and Marketing Expenses($mm) |
| 2018 | 135 |
| 2019 | 594 |
| 2020 | 957 |
| 2021 Q1 | 333 |
| 2021 Q4 | 427 |
| 2022 Q1 | 421 |
| 2022 Q2 | 414 |

Source: Backlinko, Company Data
Doordash Net Worth
Doordash net worth as of May 1, 2023, is $23.99 billion.
| Year | Net Worth ($bn) |
| 2021 April | 47.92 |
| 2021 July | 59.29 |
| 2021 October | 65.62 |
| 2022 April | 29.64 |
| 2022 July | 25.39 |
| 2022 October | 18.23 |
| 2023 May | 23.99 |

Source: Macrotrend
Doordash Market Share
Doordash has acquired 57% of the total US food delivery market share (2021).

Source: Backlinko
Doordash Growth of Market Share
The market share grew by 9% from 2020 to 2021.
| Date | Market Share |
| July 2018 | 18% |
| September 2019 | 35% |
| April 2020 | 45% |
| October 2020 | 48% |
| January 2021 | 53% |
| April 2021 | 56% |
| May 2021 | 57% |

Source: Backlinko
Doordash Statistics by City
With a 74% market share in San Francisco, Doordash has the highest regional market share as compared to other US metropolitan cities.
| Metropolitan Area | Market Share(%) |
| San Francisco | 74% |
| Houston | 64% |
| Dallas-Fort Worth | 56% |
| Philadelphia | 54% |
| Phoenix | 53% |
| Atlanta | 46% |
| Los Angeles | 44% |
| Chicago | 38% |
| Boston | 35% |
| New York | 35% |

Source: Backlinko
Doordash Driver Stats
- There were 2,000,000 dashers (Doordash drivers) in 2021.
- Doordash drivers were making $1.45 per hour on average in 2020.
- As of February 2021, 55% of their drivers were women.
- 90% of Doordash drivers work 10 or fewer hours per week.
- On average, Dashdoor drivers work 4 hours per week.
- Doordash courier in Q1 2021 was 2 million.
Source: Querysprout, Thrivemyway
Doordash User Demographics
- 34% of Doordash users are aged between 18-24, and 30% of those are aged between 25-34.

Source: Start.io
Doordash Reviews
Doordash has 4.5/5⭐ out of 89 reviews.

Doordash Positive and Negative Review Ratio
If we consider 4-5⭐ as positive reviews and 1-2⭐ as negative reviews then Doordash’s positive reviews comprise 92%. And negative reviews comprise only 8%.
Source: GetApp
Doordash Competitors
Just like Doordash, there are the more famous delivery apps that are ruling the US marketplace.
Let’s compare their stats with Doordash.
Recommended: Bumble Revenue and Usage Statistics 2022
Doordash vs Ubereats
Ubereats was launched in August 2014 (after Doordash 2013) and in 2019 it surpassed Grubhub to gain the number two spot in the best food delivery companies ranking. The annual spend per consumer is $220.37.
Doordash vs Ubereats Statistics
- Ubereats is available in over 6000 cities across 45 countries whereas Doordash is only available in 4000 cities in North America
- Ubereats has 900,000 partnered restaurants and on the other hand, Doordash has 390,000 partner restaurants and grocery stores.
- Ubereats reached $8.3 billion in revenue in 2021 and Doordash gained $4.88 billion in 2021.
- There are 81 million active users on Ubereats whereas Doordash has 25 million active users(2021).
Source: Business of Apps
Doordash vs Grubhub
Launched in 2004, Grubhub is ranked #3 in the food delivery ranking. It generated $2.1 billion in revenue in 2021. In January 2020 Grubhub was acquired by Just Eat Takeaway at $7.1 billion.
Doordash vs Grubhub Statistics
- Grubhub has 3,00,000 partnered restaurants and Doordash has 390,000 partnered restaurants.
- 65,000 Grubhub drivers deliver the food for them whereas 2,000,000 drivers deliver the food for Doordash.
- New York has the highest user percentage of Grubhub and Doordash has the most users in San Francisco.
- Grubhub has 30 million active users whereas Doordash has 25 million active users in 2021.
Source: Business of Apps
Doordash vs Instacart
Instacart was launched in 2012 and for the first time, it gained profit in 2020 which too $50 million. The average annual spend by Insacart’s users is $512 whereas its express customers spend $5000 per year.
Doordash vs Instacart Statistics
- Instacart has 9.6 million active users whereas Doordash has 25 million active users in 2021.
- Instacart has 600,000 delivery agents. Doordash has 2,000,000 delivery agents.
- Instacart is available in 5,500 cities in the US and Canada. Doordash is available in 4000 cities across North America.
Source: Business of Apps
Conclusion
By looking at the above Doordash stats, we can clearly say that Doordash is growing at a faster rate. Since its launch (2013) Doordash has gained 389,930 more restaurant partners and grocery stores.
Apart from that, the food delivery sector is highly competitive, and thus to give you an overview of Doordash’s competitors we have added a bit of information about Ubereats, Grubhub, and Instacart as well.
We hope that through this article you would gain some new pieces of knowledge, though we have added all the Doordash stat if you still think that we have missed something important, do let us know in the comment section below and we will try our best to add it.